
About Me
Hello, and welcome to my data analytics portfolio!
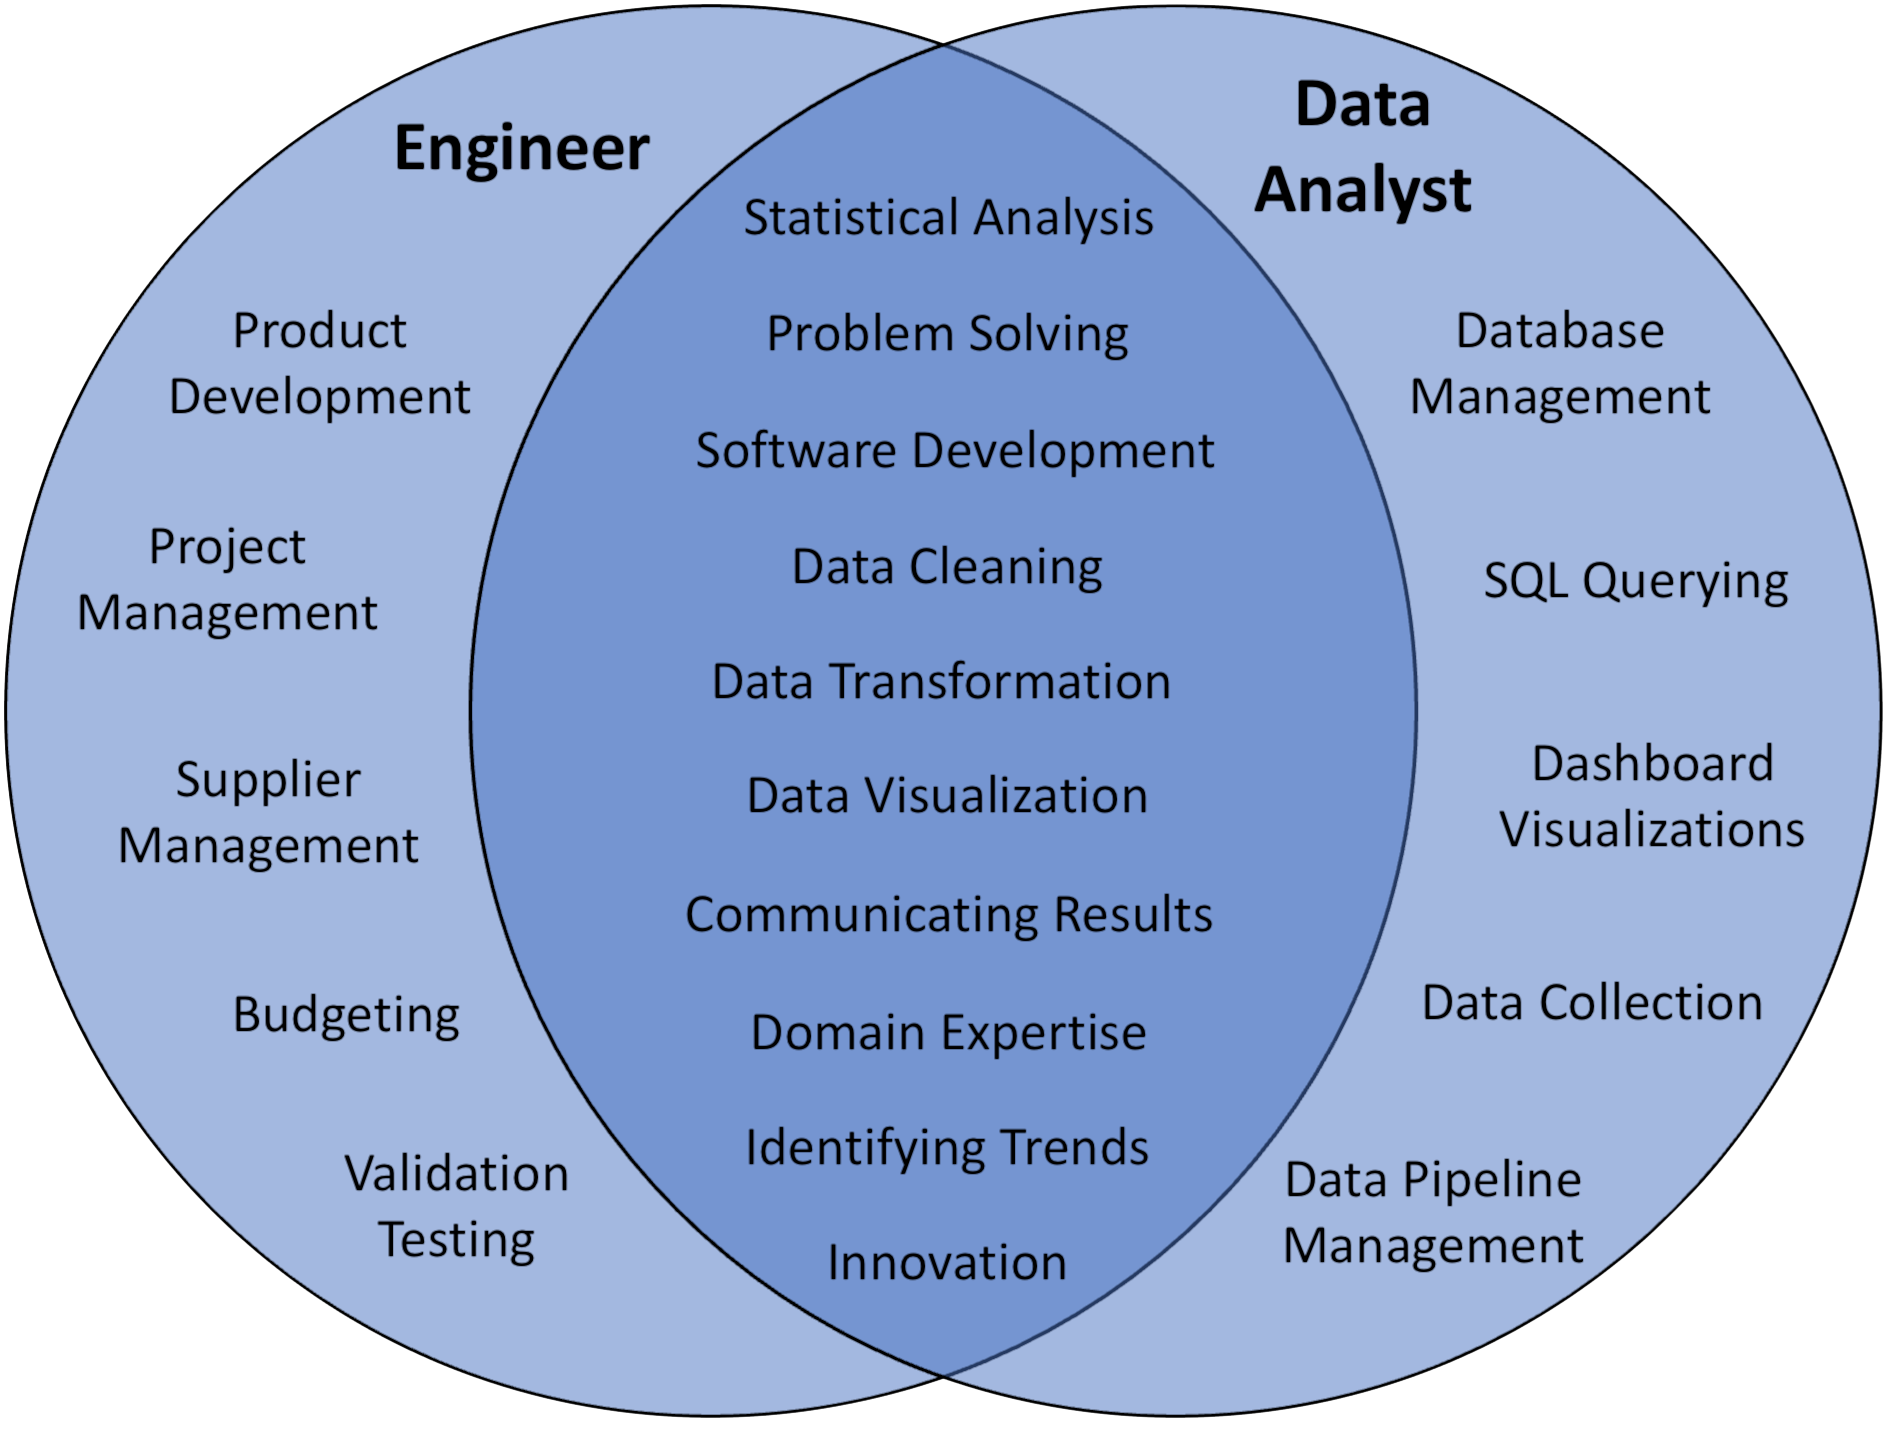
As a former Mechanical Engineer, data was front and center to my work. While being an engineer is often characterized by a talent for product innovation and high level math, it takes a lot more than that to be successful. Engineering also requires a deep skillset in working with data (sometimes quite a lot of data) and telling a story that communicates your results in a clear and concise way to your stakeholders. While the greatest tool at any engineer’s disposal is and probably will always be Excel, it quickly became apparent in my engineering journey that there was more to the world of data analytics than generic tables and simple scatter plots. I started learning the power of python and how it could be used for not only deeper customization in my analysis, but also in optimizing my workflows. I learned about Power BI and Tableau which vastly changed my perception of data visualization and its ability to make data both easier to digest and more engaging. I learned how to properly wrangle large datasets with structured databases and SQL. I also learned about machine learning and its use as a powerful predictive tool when flooded with data variables. Overtime, I started to notice the growing overlap between what it means to be a good engineer and a good data analyst.
Today, I continue that journey as I pursue ever-growing expertise in data analytics. This portfolio highlights the growth of my skillset as I apply a variety of data analytics tools and strategies to personal datasets I find interesting. The beauty of data analytics is the ability to obtain insights into the world around you and using these findings to make informed decisions. Sometimes data analysis findings are just something fun to learn, but other times it can provide profound insights that can lead you to whole new ideas and directions. That’s what makes data analytics fun AND rewarding.